// NATURE NEWS — SPAZIO & SCIENZA
Population-scale immune multiome atlas reveals regulatory disease mechanisms
Nature
(2026) Cite this article
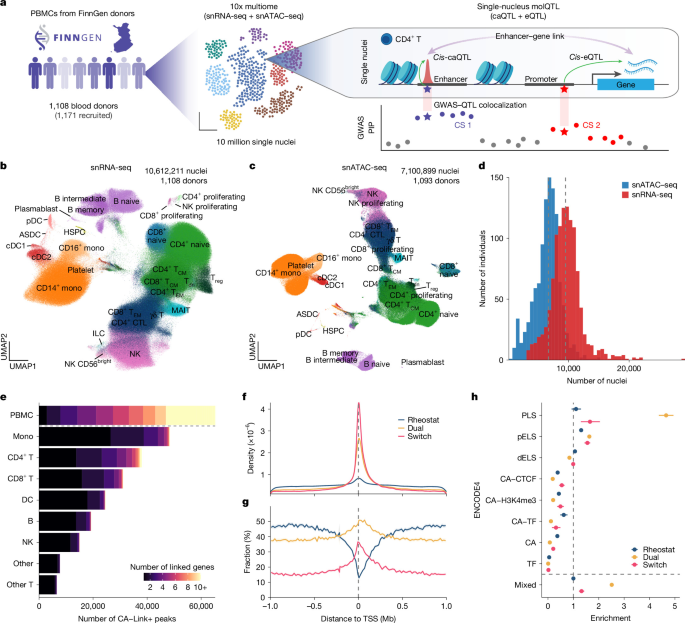
Most disease-associated genetic variants lie in non-coding regions1,2, yet mechanistic insights are limited by the lack of an empirical framework for characterizing the molecular consequences of regulatory variation. Single-cell molecular quantitative trait locus (QTL) mapping3,4 connects variants to gene regulation but lacks the power and simultaneous measurements to trace mechanisms from chromatin to expression5. Here we show that population-scale simultaneous profiling of chromatin accessibility and gene expression across immune cells reveals regulatory architectures connecting variants to disease. From paired single-nucleus assay for transposase-accessible chromatin-sequencing (snATAC–seq) and single-nucleus RNA-sequencing (snRNA-seq) analysis of 10 million peripheral blood mononuclear cells in 1,108 Finnish individuals6, we identify 51,083 cis-expression QTLs for 20,829 genes, 338,100 cis-chromatin accessibility QTLs for 210,584 peaks, 119,094 putative causal variants and 593,765 peak–gene links. Variants completing chromatin-to-expression cascades show twice the disease colocalization of chromatin-only effects, with massively parallel reporter assays7 validating 10,428 fine-mapped molecular QTLs. At evolutionarily constrained genes, we identify multilayered regulatory buffering, in which chromatin accessibility changes occur with normal effect sizes, but transmission to expression is attenuated through weaker, more numerous enhancer–gene links. This reconciles why disease variants preferentially target constrained genes despite apparent expression QTL depletion8,9,10,11. Analysis using a massively parallel reporter assay7 confirms that this buffering acts downstream of the regulatory element, with constraint operating at the chromatin-to-expression interface rather than on intrinsic cis-regulatory activity. Our atlas provides testable hypotheses for over half of immune disease associations, illustrated by cascades at autoimmune loci (TICAM1 and RHOH) and Finnish-enriched variants (TNRC18 and IL21R).
This is a preview of subscription content, access via your institution
Access Nature and 54 other Nature Portfolio journals
Get Nature+, our best-value online-access subscription
Prices may be subject to local taxes which are calculated during checkout
The FinnGen single-nucleus caQTL, eQTL, peak–gene link summary statistics generated in this study are publicly available at https://www.finngen.fi/en/access_results and interactively browsable at https://cascade.finngen.fi/. The FinnGen GWAS summary statistics (R12) are available at https://r12.finngen.fi/. The KANTA lab value GWAS summary statistics are available at https://labvalues.finngen.fi/. The FinnGen (R12) + MVP + UKBB meta-analysis results are available at https://mvp-ukbb.finngen.fi/. Individual-level data, including single-nucleus count matrices, are available to approved researchers. FinnGen as a research project is granted use of national healthcare data and biospecimens according to national (Finland’s Act on the Secondary Use of Health and Social Data) and European (the General Data Protection Regulation) regulations, which preclude the research project from distributing individual-level data. Those wishing to work with individual-level data can apply through three independent channels. Health register data are requested from Findata (https://findata.fi/en/). Individual-level genotype and other profiling data generated by the project from Finnish biobanks are requested through the Fingenious portal operated by the Finnish Biobank Cooperative (https://site.fingenious.fi/en/). The Blood Service Biobank is not a member of the Finnish Biobank Cooperative, and its materials, including the individual-level single-nucleus multiome data generated in this study, are requested directly from biopankki@bloodservice.fi. Academic users wishing instead to collaborate with the FinnGen project directly can fill i