// HACKER NEWS — CYBERSECURITY
Geothermal heat map of US hot springs
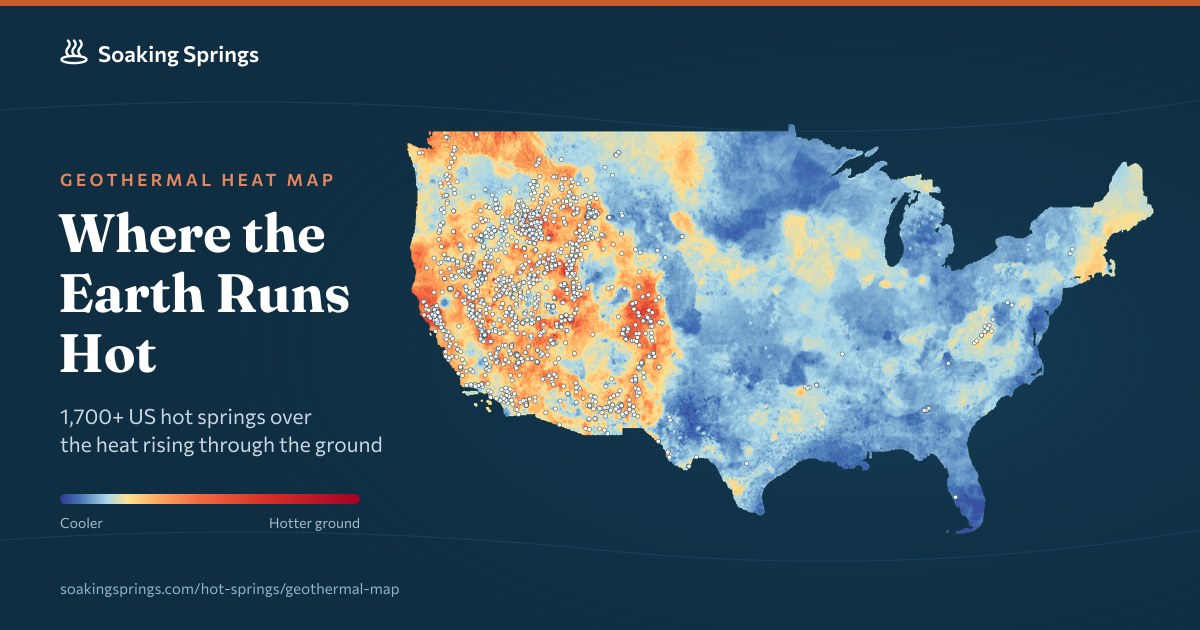
Every hot spring on this site, plotted over a map of the heat rising through the ground.
The warm colors mark where heat from deep in the earth reaches the surface fastest, and the springs crowd into them.
Tap a pin for the spring's water temperature and heat flow. Alaska and Hawaii springs are on the map without a heat flow value.
Heat flow measures how much warmth works its way up from deep inside the earth, in milliwatts per square meter.
Across the United States it averages about 65.
Most of the West runs well above that. The crust there has been stretched thin and broken by faults, which leaves hot rock
closer to the surface. Rain and snowmelt sink down through those cracks and come back up hot.
The cool blue East has only a scattering of springs. Most of them, like the ones in Hot Springs, Arkansas, and Warm Springs, Virginia,
come from water that circulates unusually deep before it surfaces.
Heat flow at each spring, from the Stanford Thermal Earth Model.
Measured water temperature. Many of the hottest are geysers and boiling pools that nobody can soak in.
Median heat flow at the springs in each state. The dashed line marks the US average of 65.
Landsat's thermal camera reads the temperature of the ground from about 440 miles up. On a clear winter day the biggest
geothermal areas glow against the frozen land around them. Each card pairs a photo of the spring, or an aerial view where
there's no good photo, with what the thermal camera saw.
Midway Geyser Basin, home of Grand Prismatic Spring. The bright thread running through it is the Firehole River, which hot runoff keeps free of ice all winter.