// HACKER NEWS — CYBERSECURITY
Burning Man Death Rates – A Short Lesson in Statistics
Summary: Three people died at Burning Man in 2026. This was about a quarter of what the crude national rate would predict (~12 deaths). Calculating the age-standardized death rate, we’d expect to see an average of 4.9 deaths. At this rate, seeing 3 deaths is not abnormal. However, Burning Man’s near zero death rate over its existence is abnormal, and likely due to selection bias of healthier attendees and other confounding demographic factors.
The Burning Man event this year (2026) had three confirmed deaths. It made a few headlines as this was the highest recorded number. For an event that has mostly seen no deaths during its 3+ decade existence, this was abnormally high. But I’m curious, compared to the rates we see in the general population, was observing three deaths abnormal? Let’s dive into the numbers and find out for ourselves.
The Black Rock City Census 2025 Population Report has a great demographic breakdown of the 2025 Burning Man population. Of course, we’re comparing 2026 deaths with 2025 data, but we’ll go ahead and say that the attendee makeup is about the same between both years.1
The two largest income groups continued to increase in participation, with the second largest income group ($100,000 to $299,999 yearly) representing over a third of attendees.
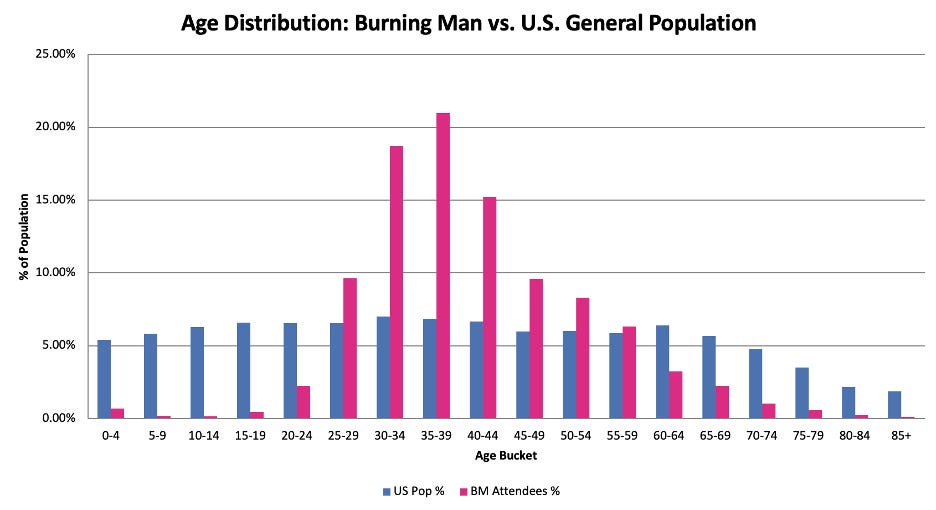
These slices of Burning Man attendees represent a unique population, not indicative of your average US population. I took the Burning Man age distribution and overlaid that with that of the general US population:
The Burning Man population is significantly younger than the oldest in the US population, where death rates are much higher. Keep this chart in mind going forward.
Let’s do the simplest comparison we can. The crude all-cause mortality rate in the general US population was 909.3 deaths per 100,000 people, per year.2 And at Burning Man, we observed 3 deaths per approximately 70,000 people in 1 week.
If we scale 909.3 deaths over 100,000 person-years to 70,000 people-weeks (70,000 people * 1 week), we get 12.2 deaths.3 That is, if we randomly select 70,000 people from the US population and observe them for 1 week, we’d expect to see 12.2 deaths on average.4
Before, 3 deaths seemed abnormally high, but now we’re saying that 12.2 deaths, over 4x what we observed, is expected. What gives?
You’ll recall that the Burning Man population is quite unique. The attendees are younger, more educated, and higher earners than the general US population. That might explain why we see such a big difference in expected vs observed rates.