// NASA BREAKING NEWS — SPAZIO & SCIENZA
The Human Fingerprint on Earth’s Water Cycle
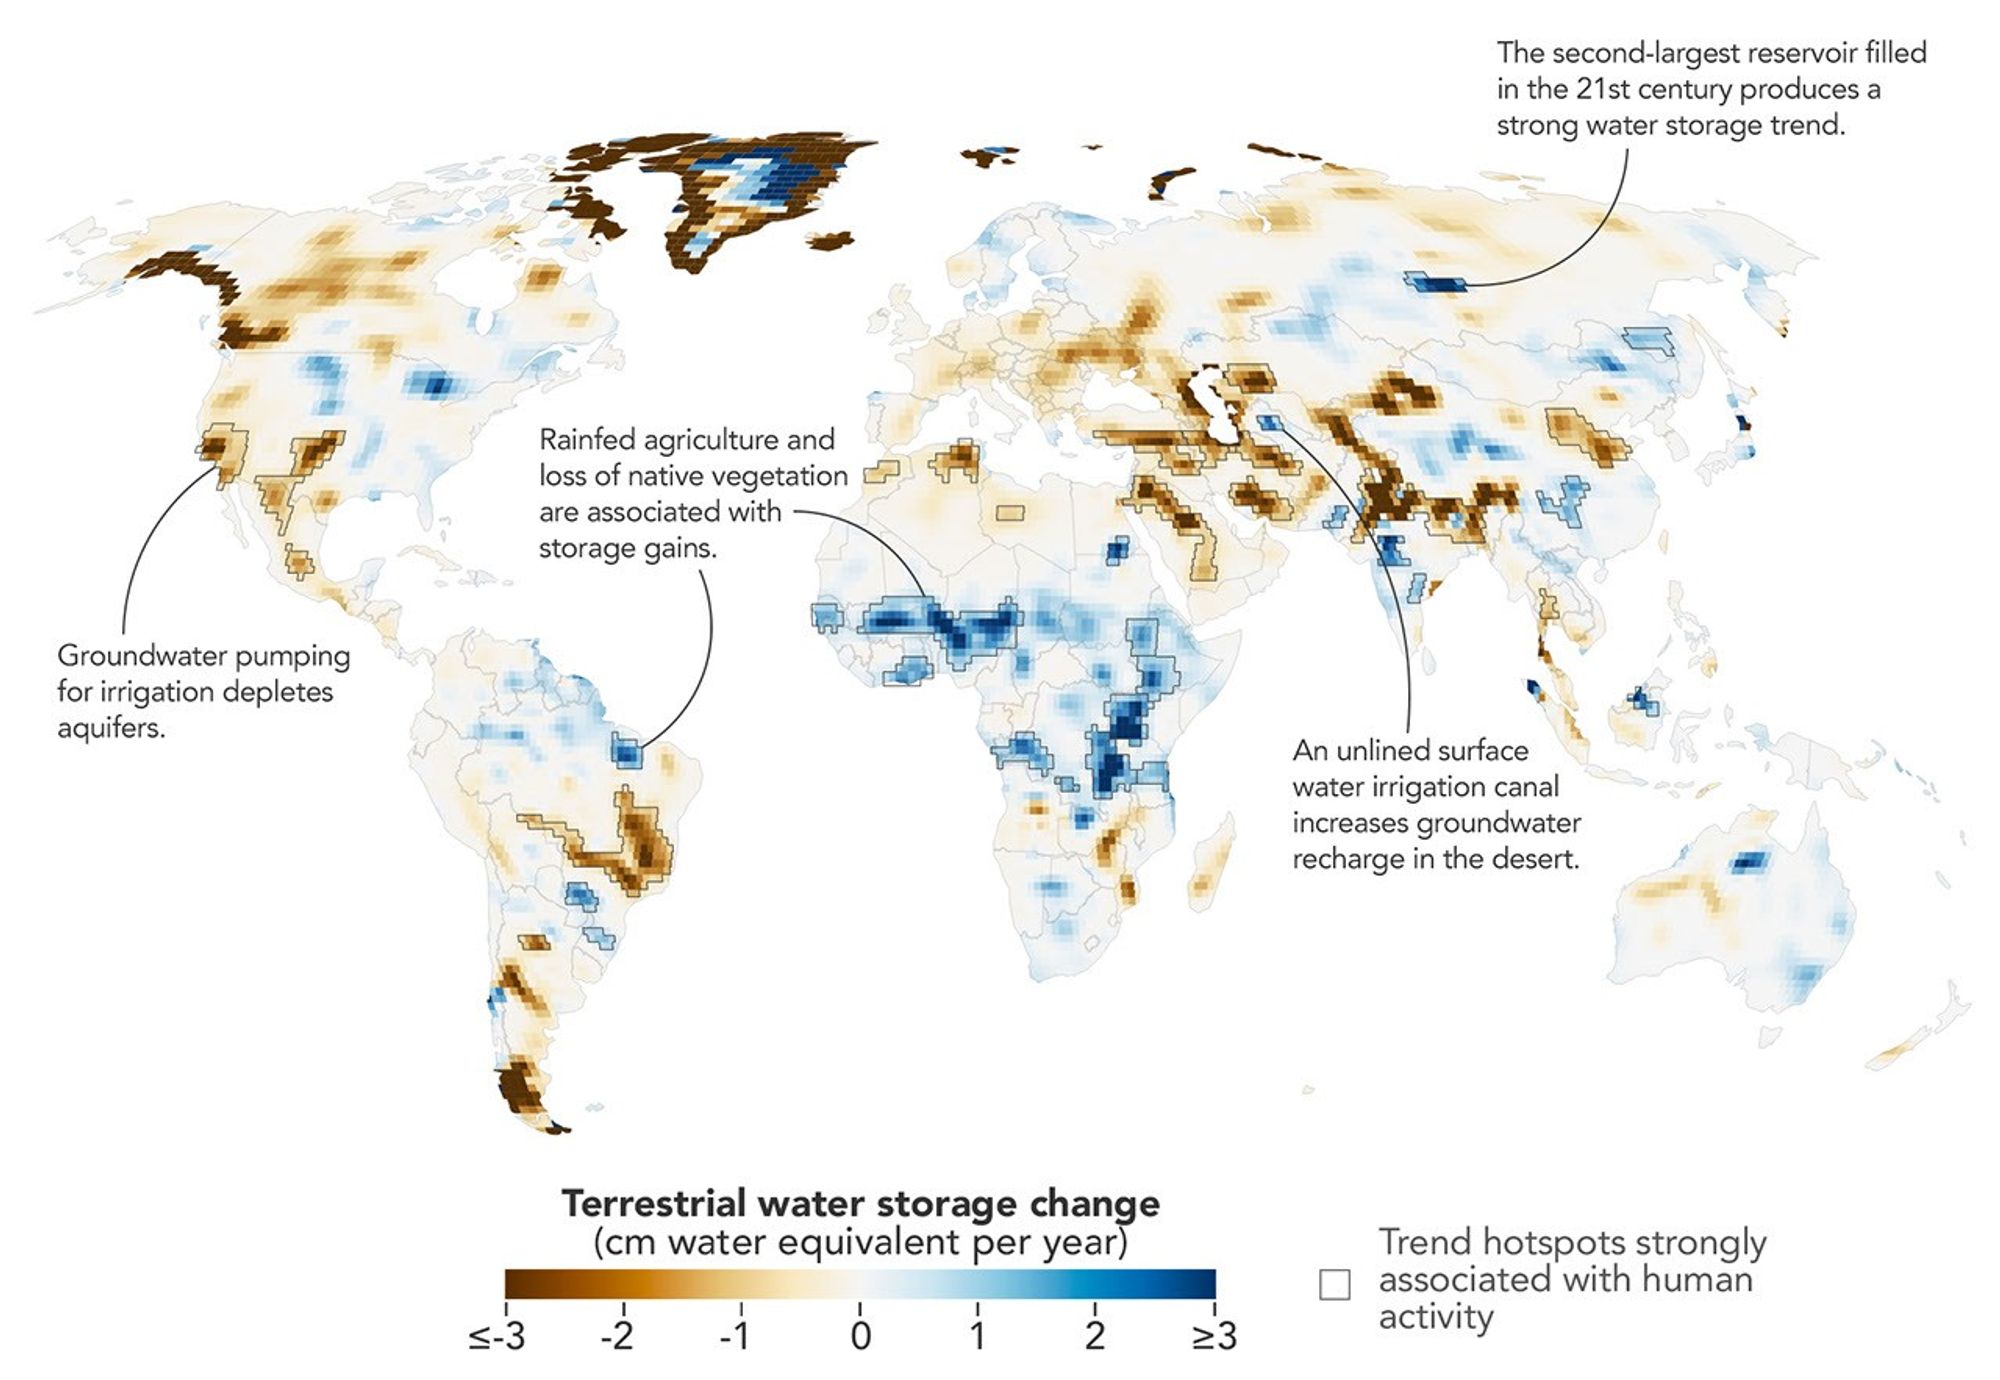
Human activities have become intertwined with how water is distributed across the continents. A new study brings their effects into sharper focus.
Humans are exerting increasing influence over how water moves through lakes, rivers, soil, and the subsurface, and a new NASA study shows where those effects are greatest. Using more than two decades of satellite measurements of subtle changes in Earth’s gravity, the researchers sharpened the picture of how—and why—terrestrial water storage has changed.
This map encapsulates their findings, depicting changes in terrestrial water storage from April 2002 to November 2025. Beyond the influence of climate variability, the scientists identified 40 regions where the changes also aligned with human activities such as irrigation, reservoir impoundment, and land-use change. These activities were significantly related to terrestrial water storage trends on every nonpolar continent except Australia.
In some areas, the effects of human activities were especially strong. “In four continental regions, an anthropogenic variable showed a stronger relationship with the storage trends than any climate variable did,” said Mary Michael O’Neill, a hydrologist at NASA’s Goddard Space Flight Center and lead author of the study.
They include well-known spots such as California’s Central Valley and northern India, where farmers’ heavy reliance on groundwater has drawn down storage—in India’s case, faster than earlier estimates suggested. Elsewhere, some types of farming and water management appear to have done the opposite.
The data behind the map come from the GRACE (Gravity Recovery and Climate Experiment) and GRACE-FO (GRACE Follow-On) missions, each of which consists of two satellites that fly in tandem. As the lead satellite passes over an area with greater mass, the slight change in gravity tugs at it, and instruments aboard the satellites measure the change in distance between them. Since water and ice are heavy and shift around regularly, scientists can use GRACE data to infer gains and losses.
The satellites’ data are typically processed into monthly maps that show broad patterns of water storage. But over more than 20 years, the satellites have passed over most of the planet many times. By combining all of those passes, the researchers could map long-term water trends with five to 10 times more spatial detail than previous analyses. The tradeoff was a loss of temporal detail. They then applied statistical techniques to weigh the importance of various anthropogenic and climatic factors in the storage trends and to pinpoint where human activities may have contributed.
The improved spatial resolution uncovered some human impacts that had not been previously detected, said Matthew Rodell, deputy director of Earth Sciences for Hydrosphere, Biosphere, and Geophysics at Goddard and one of the study’s authors. The analysis also showed that some known trends were stronger than previously realized.
Across several continents, groundwater-irrigated farmland was strongly associated with declines in terrestrial water storage. In North America, these declines appeared in California’s Central Valley, the southern High Plains of the U.S., and Chihuahua, Mexico, where long-term droughts have increased farmers’ reliance on groundwater. Groundwater pumping also drove declines in northern India, where the refined analysis showed a steeper downward trend than previously realized. Consistent with previous findings, retreating Himalayan glaciers accounted for only 15 percent of the decline there.
Other types of agriculture had a different relationship with water storage trends. In parts of sub-Saharan Africa, for example, some increases occurred where rainfed cropland has expanded. There, swaths of native savanna were replaced by millet cultivation throughout the study period, and water tables rose despite below-average precipitation. A similar pattern emerged in northern Brazil’s Maranhão state, where soybean f