// NATURE NEWS — SPAZIO & SCIENZA
Dataset artefacts can partially drive the measured decline in disruption
Nature
volume 656, pages E7–E13 (2026) Cite this article
Matters Arising to this article was published on 12 August 2026
The Original Article was published on 04 January 2023
arising from: M. Park et al. Nature https://doi.org/10.1038/s41586-022-05543-x (2023).
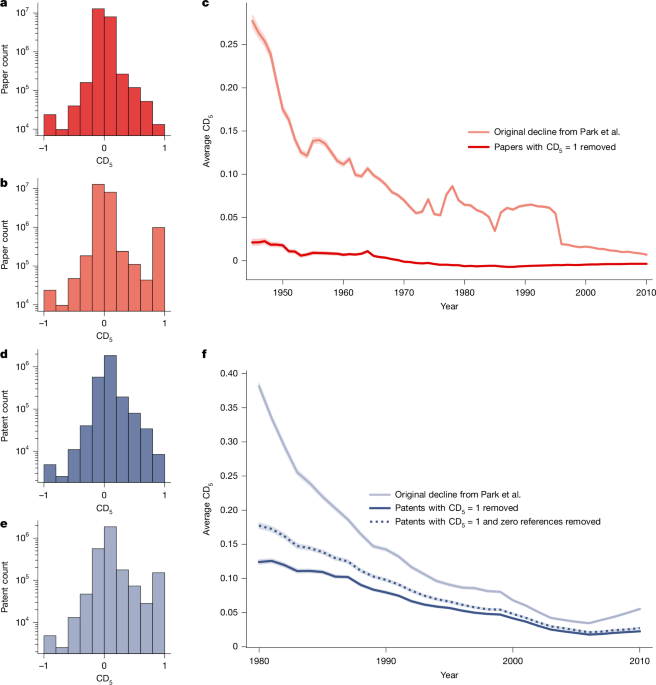
Park et al.1 applied the CD index2, a measure of disruption in citation networks, to databases containing almost 45 million papers and 3.9 million patents. They reported a decline in the relative amount of disruptive scientific papers and technological patents in the past decades. Our re-examination, including a thorough assessment of the robustness checks conducted by Park et al.1, shows that a part of the reported decline in disruptiveness can be attributed to a relative decline of database entries with zero references, which have a maximum CD index of 1. Moreover, closer inspection of the source documents corresponding to these entries with zero references reveals that most of them do in fact contain references, indicating that the main effect on the measured disruptiveness seems to be weakened by artefacts in the dataset.
This is a preview of subscription content, access via your institution
Access Nature and 54 other Nature Portfolio journals
Get Nature+, our best-value online-access subscription
Prices may be subject to local taxes which are calculated during checkout
The Web of Science and the PatentsView data for the study were retrieved from the public repository (https://doi.org/10.5281/zenodo.7258379 (ref. 10)) made publicly available by Park et al.1. The SciSciNet data source4 (https://doi.org/10.6084/m9.figshare.c.6076908 (ref. 11)) and the DBLP citation network v146 (https://www.aminer.cn/open/article?id=655db2202ab17a072284bc0c) are publicly available to download. The data for the reanalysis that we performed on these two datasets are publicly available at https://github.com/VincentHolst/reanalysis_declining_disruption (ref. 12). The data used to recreate Supplementary Fig. 17 were obtained either as source data from ref. 1 or by digitizing figures from refs. 13,14 using WebPlotDigitizer (https://automeris.io), and are publicly available alongside the other reanalysis data.